Understanding nuances of garbage collection and ways to tune it with real world example
In one of my previous post I elaborated basics of JVM memory and also explained how garbage collection works. In this post we will try to understand various types of GC and how to tune and optimize them with a real world example.
GC Taxonomy
1. Minor GC
When garbage is collected from Young space it is called Minor GC.
Characteristics
- Triggered when JVM is unable to allocate space for a new object in Eden space. Implicitly it means that higher the allocation rate, higher its frequency
- May trigger stop-the-world (STW) pauses, which thereby suspends application threads. In a healthy applications these pauses will be negligible
2. Major GC
When garbage is collected from Old space it is called Major GC.
3. Full GC
When garbage is collected from entire heap i.e. Young and Old spaces it is called Full GC.
In nutshell we can infer that Major GCs would be an outcome of number of Minor GC. From performance standpoint what needs to be closely monitored and analyzed is - whether a GC had suspended application thread (i.e. STW) and what was the time for suspension. As this may have larger ramifications on throughput and latency of application.
Types of GC
1. Serial GC
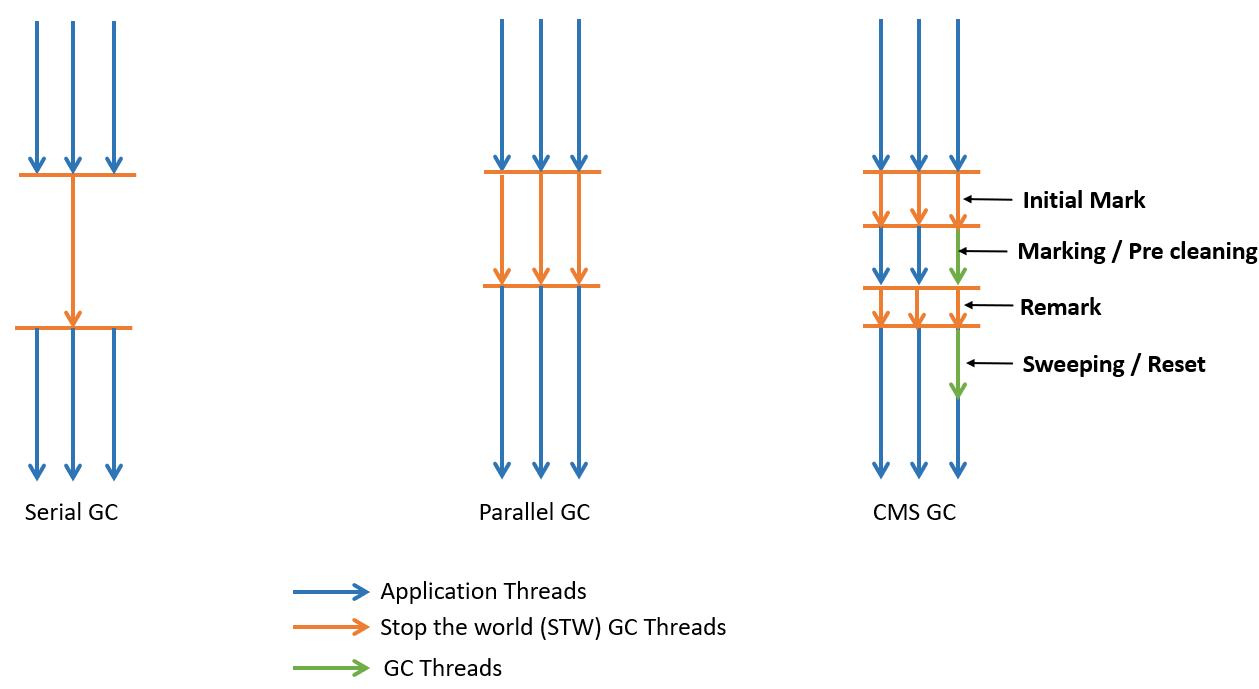
As the name implies, this garbage collector is incapable of parallelizing the GC task at hand. Basically it is recommended for environments which has few hundred MBs of memory and a single CPU. They will trigger STW pauses and thereby suspend all application threads.
2. Parallel GC
As the name implies, this garbage collector is capable of parallelizing the GC task at hand. Both old and young generation will trigger STW pauses for performing garbage collection and thereby suspend all application threads. Number of threads used during garbage collection is configurable via JVM argument i.e.
-XX:ParallelGCThreads=N
The default value is equal to the number of cores of the machine in which application is required to run. Till JDK8 Parallel GC is the default GC algorithm for any application.
3. Concurrent Mark and Sweep (CMS) GC
It basically uses parallel STW algorithm for young generation and CMS algorithm for old generation. Below are the phases of this algorithm
| Name of the phase | Brief description | STW ? |
|---|---|---|
| Initial Mark | Collect all the garbage collector roots | Yes |
| Concurrent Mark | Garbage Collector traverses the Old Generation and marks all live objects, starting from the roots found in the previous phase | No |
| Concurrent Pre-clean | Objects that have their fields changed are marked by the JVM as dirty. These objects are accounted for and marked as live | No |
| Concurrent Abortable Preclean | It is primarily meant to reduce the load of STW final remark phase | No |
| Final Remark | Finalizes marking all live objects in the Old Generation | Yes |
| Concurrent Sweep | Remove unused objects and reclaims the space occupied by them for future use | No |
| Concurrent Reset | Resets data structures of CMS algorithm to make them clean and available for next run | No |
Looking at the above phases one can easily make out that this is designed to avoid long (STW) pauses whilst collecting in old generation. This is the recommended choice for multi core CPUs and also for applications which are latency sensitive.
Garbage Collector overheads
Before we understand nuances of various GC parameters to tune, lets try understanding facts pertaining to GC overheads. The two biggest contributors to GC overhead are -
1. Allocation Rate - It is memory allocated per unit time. It can be calculated as difference in size of Young Generation after the completion of last collection and before the start of next one. An excessively high allocation rate may have dire ramifications on performance of your application. It primarily has to do with Minor GC i.e. Young Generation. However it may have an implicit impact on Promotion Rate. Logically one may want to think that if there are issues with allocation rate than one must blindly increase the size of Young Generation i.e. Eden space. However, that's a misconception, as if problem is really genuine, than we are just deferring the actual problem and not solving the root cause by doing so. Below are the key JVM flags that can be considered for troubleshooting allocation rate issues -
| JVM Flag | Description |
|---|---|
| -XX:NewSize | Sets size of new generation in bytes |
| -XX:MaxNewSize | Sets max size of new generation in bytes |
| -XX:NewRatio | Ratio of old is to new generation |
| -XX:SurvivorRatio | Ratio of Eden to Survivor size |
2. Promotion Rate - Amount of data (i.e. size of objects) propagated from Young Generation to the Old Generation per unit time. In the JVM world its a norm to have long lived objects getting promoted from Young Generation to Old Generation. Relatively speaking promotion rate has more dire ramifications on performance of application than Allocation Rate. And this is due to simple reason - promotion rate is directly proportional to frequency of Major GCs. Now this is quite evident from the fact that, the more JVM promotes to Old Generation, the faster it fills up. The faster Old Generation fills up, frequency of Major GC to clean up Old Generation will substantially increase. Due to (mis)configuration it may happen that short lived objects are not collected in Young Generation, but instead they are promoted to Old Generation and are getting garbage collected via Major GC - this is known as **PREMATURE PROMOTION. **And this may lead to longer pauses of application threads due to frequent Major GCs. Symptoms of Premature Promotion -
- Application is required to go through frequent Full / Major GC runs over a short period
- Old generation consumption after each Full GC is high
- Promotion Rate nearing allocation rate
JVM flag that can be used to manage promotion rate
| JVM Flag | Description |
|---|---|
| -XX:MaxTenuringThreshold | Sets max tenuring threshold to be used for GC. Default is 15 for parallel and 4 for CMS GC |
Tuning Garbage Collection in a real world application
In one of the application which was in production for more than 4 years with moderately high adoption, I was primarily responsible for optimizing performance of application. As part of this exercise, I took this opportunity to understand its GC behavior. Below are the findings and inferences based on GC reports (generated by importing GC log file using GCEasy.)
1. Initial Analysis
Whilst skimming through performance reports and some of GC logs, we observed that allocation failures were happening in large proportion ~ 90%.
Lets try to understand - What does that mean and how does it impact performance of application.
We looked at Allocation Rate which clearly indicates that while new objects are being created and old objects are moved across Young / Old generation, JVM might end up in state where it is unable to create new objects as the memory is too less / too fragmented. In both the case, GC will be triggered and hence GC events, which will impact throughput and latency of the application.
2. Moving from default GC to CMS GC
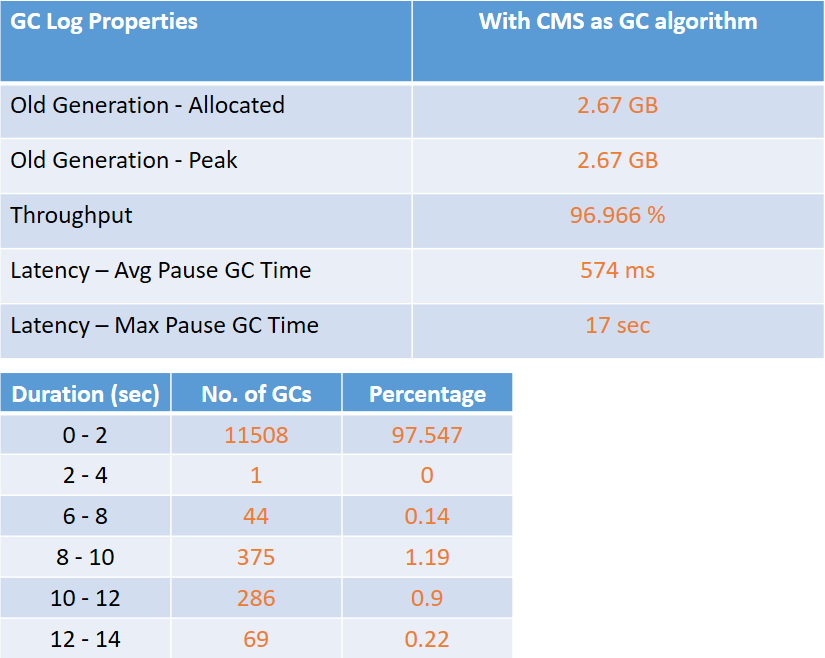
Above report indicating high Allocation Failure is due to high fragmentation in memory and hence GC needs to be triggered. So we started analyzing GC behavior and thereby found out that application was using default GC i.e. Parallel GC, which can have latency issues. So we decided to change its algorithm to CMS and then analyzed GC logs. Below are the readings after changing from default GC to CMS GC
With CMS GC we were able to see significant amount of gain in terms of -
- 50% reduction in Allocation Failure
- 84% reduction in Max Pause GC time
3. CMS GC as performance degrader!
Considering this gain in lower environment, we pushed GC related changes to production. And in spite of full blown performance testing in lower environment destiny had something else in store for us :) When we started analyzing GC logs from PROD this is what we saw in its reports :(
Significant observations that may have impact on performance of application -
- Max pause GC time of 17 sec . . . .whola !!! that’s too much
- Old generation fully getting occupied
4. Optimizing and Tuning CMS GC
We again started analysis of different flags available in JVM for optimizing CMS GC behavior. As part of analysis we came across below mentioned flags
- UseCMSInitiatingOccupancyOnly - Prevents usage of JVM's GC heuristics. By default CMS GC uses set of heuristic rules to trigger GC. This makes it less predictable and thereby delay garbage collection until Old Generation is almost occupied
- CMSInitiatingOccupancyFraction - Informs JVM when CMS should be triggered. Percent value should be derived based on speed with which memory is consumed in Old Generation. Its value indicate that application should utilize less than the set percentage value of Old Generation. It should be chosen very carefully.
- ParallelGCThreads - Sets the number of threads used during parallel phases of the garbage collectors.
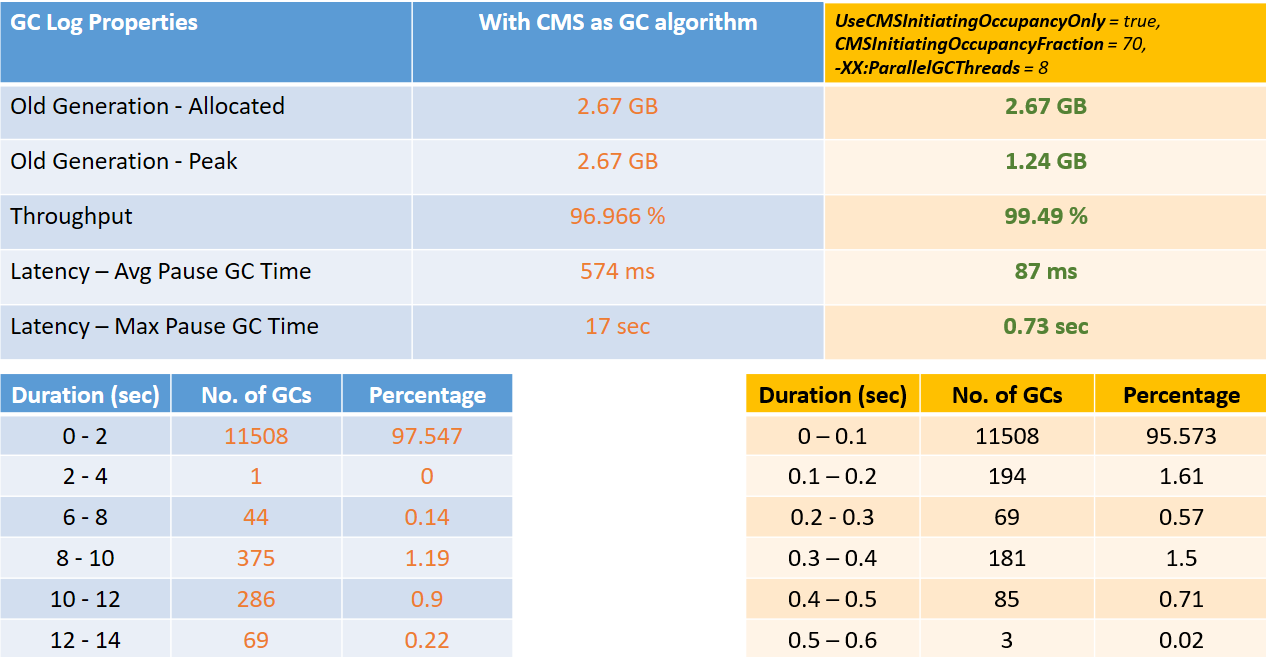
So we changed JVM parameters to below values and then tried comparing the readings
- -XX:UseCMSInitiatingOccupancyOnly = true
- -XX:CMSInitiatingOccupancyFraction = 70
- -XX:ParallelGCThreads = 8
It is clearly evident from above readings that by adding above mentioned flags we can see significant improvements in terms of -
- 95% reduction in Max Pause GC time
- 84% reduction in Avg Pause GC time
- Old generation consumption has reduced by 53.5%
- 2.5% increase in throughput
These are indeed huge gains as compared to initial readings which will positively impact performance (i.e. latency and throughput) of application in general.
Conclusion
We saw from above readings that tuning application's GC requires detailed understanding of nuances of Garbage Collection. Needless to say that one needs to adopt a slow and iterative approach to find the right values of configuration as it is very specific to the nature of usage and business complexity of application.
P.S - There are couple of more flags which can be considered based on the need of application i.e.
- -XX:+ScavengeBeforeFullGC
- -XX:+CMSScavengeBeforeRemark
It indicates garbage collector to collect young generation before doing Full GC or CMS remark phase and thereby aid in improving its performance due to absence of need to check references between young generation and tenured.
In case you have some experience w.r.t. GC and its tuning to share, feel free to share it through comments - collaboration will definitely help us to enhance knowledge and understanding of our community. Alternatively you can DM me, should you have any queries / clarifications in regards to GC and its tuning and optimization.
comments powered by Disqus


