Monitoring Spring Boot application using Actuator, Micrometer, Prometheus and Grafana

Spring Boot helps developers to implement enterprise grade applications which can be pushed to production in no time. Once application gets into production and if we strongly believe in vedic philosophy of Karma :), we are bound to experience Murphy's Law.
Whatever can go wrong, will go wrong
Considering nature of Distributed Architecture, Observability and Monitoring of application and infrastructure is of paramount importance. Thanks to the Spring Boot team, who has shipped Spring Boot Actuator from the very first release.
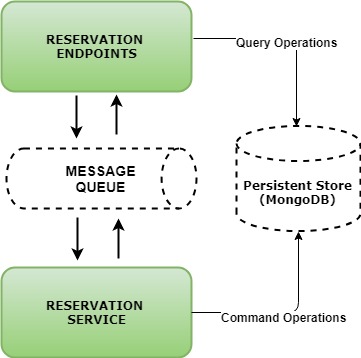
In order to understand Spring Boot Actuator and its usage w.r.t observability and monitoring in real world application, lets construct a system with hypothetical requirements - We will implement an application which consists of two applications -
- Reservation Endpoints - which consists of public APIs for managing Reservation workflows
- Reservation Service - responsible for catering to Command operations (as a part of CQS). It is primarily entrusted with responsibility of consuming events / messages pertaining to Save Reservation operation
Application Architecture
Source code of both the applications can be referred at -
Below are the APIs exposed by Reservation Endpoints
| Business Operation | URI | HTTP Method | Description | | -------- | -------- | ------ | | Add Reservation | /reservation | POST | Allows to add Reservation with user details | | Fetch all Reservations | /reservations | GET | Returns list of all the users whose reservation has been done | | Fetch all Reservations by first name | /reservation/firstName/{firstName} | GET | Returns list of all the users with given first name whose reservation has been done | | Fetch all Reservations by last name | /reservation/lastName/{lastName} | GET | Returns list of all the users with given last name whose reservation has been done |
Before we delve into nuances of Monitoring and Observability of distributed systems, lets understand how to get required metrics
Spring Boot Team has shipped Spring Boot Actuator from the very first release.
So Spring Boot actuator exposes set of endpoints over HTTP or JMX. It can be enabled by adding 'spring-boot-starter-actuator' dependency within build file -
Maven Configurations
1<dependencies>
2	<dependency>
3		<groupId>org.springframework.boot</groupId>
4		<artifactId>spring-boot-starter-actuator</artifactId>
5	</dependency>
6</dependencies>Gradle Configurations
When you run your application, it exposes set of endpoints relative to '/actuator' URI which are as shown below

The same can be viewed over JMX
One can see the complete list of actuator endpoints at the official documentation.
Spring Boot properties that can be used for enabling / disabling actuator endpoints -
1########################## Actuator Configurations
2# Use "\*" to expose all endpoints, or a comma-separated list to expose selected ones i.e. health,info
3management.endpoints.web.exposure.include = \*
4
5# Use "\*" to expose all endpoints, or a comma-separated list to expose selected ones
6management.endpoints.jmx.exposure.include = \*Customization of Management Endpoints
Since its inception, Spring has always preferred giving customization and extension hook points at appropriate places within its framework. Same holds good for Actuator endpoints - which is apparent from below table
| Customiation Type | Key within application.properties | Example | Description |
|---|---|---|---|
| Customizing management endpoint | management.endpoints.web.base-path | management.endpoints.web.base-path=/abc | Changes the endpoint from /actuator/{id} to /abc/{id} |
| Customizing management server address | management.server.address | management.server.address=127.1.2.3 | Customizes management server's address to 127.1.2.3. This may be required if one wants to listen only on ops monitored network |
| Customizing management server port | management.server.port | management.server.port=8181 | Changes default port of management server to 8181. This may be needed if one has specific need of exposing endpoint on separate HTTP port (governed by the rules of its data centre) |
| Disable HTTP endpoints | management.server.port OR management.endpoints.web.exposure.exclude | management.server.port=-1 OR management.endpoints.web.exposure.exclude=/* | Disables all the HTTP endpoints exposed as a part of Actuator framework |
Note - Management endpoints can be secured in terms of its access by configuring required ssl configuration within application.properties file
Health Information
In today's contemporary world of distributed architecture, gathering health information about application and infrastructure is imperative - as it not only helps to monitor the system but also helps to setup alerts for proactive actions that need to be taken. With actuator one can get detailed health information about application along with its infrastructure by configuring below property within application.properties file
1########################## Actuator Configurations
2
3# To get the complete details including the status of every health indicator that was checked as
4# part of the health check-up process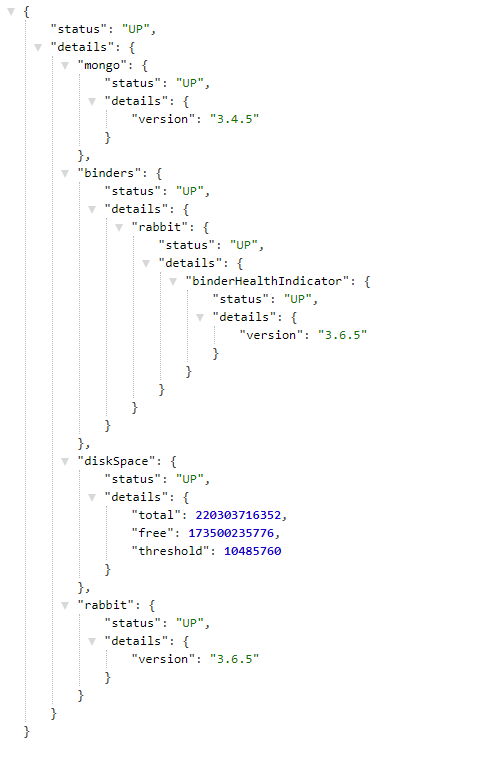
5management.endpoint.health.show-details=alwaysBy enabling health endpoints within our application, we will not only be able to see application's health information but we will also get to see infrastructure's health i.e. MongoDB and Rabbitmq as they are auto-configured
Metrics
Spring Boot mainly provides below metrics via Actuator
- JVM metrics, report utilization of:
- Various memory and buffer pools
- Statistics related to garbage collection
- Threads utilization
- Number of classes loaded/unloaded
- CPU metrics
- File descriptor metrics
- Logback metrics: record the number of events logged to Logback at each log level
- Uptime metrics: report a gauge for uptime and a fixed gauge representing the application’s absolute start time
- Tomcat metrics
- Spring Integration metrics
- Spring MVC metrics
- Spring Webflux metrics
- RestTemplate metrics
So with this understanding of basic capabilities of Spring Boot's Actuator, can we perform enterprise monitoring? Tentatively YES, but lot of things need to be built from scratch viz. Application that constantly fetches data from Actuator and then some how renders the captured data in human readable form. Spring framework community once again absolves software fraternity from doing such heavy lifting - Actuator provides dependency management and auto configuration of Micrometer. Micrometer is
"vendor-neutral interfaces for timers, gauges, counters, distribution summaries, and long task timers with a dimensional data model that, when paired with a dimensional monitoring system, allows for efficient access to a particular named metric with the ability to drill down across its dimensions"
And Micrometer in principle -
- is metrics supporting library for JVM application
- supports plethora of monitoring tools viz. Atlas, Datadog, Graphite, Prometheus etc.
We will be using Prometheus to demonstrate its capabilities using above example. In order to configure Prometheus, we just need to add below gradle dependency
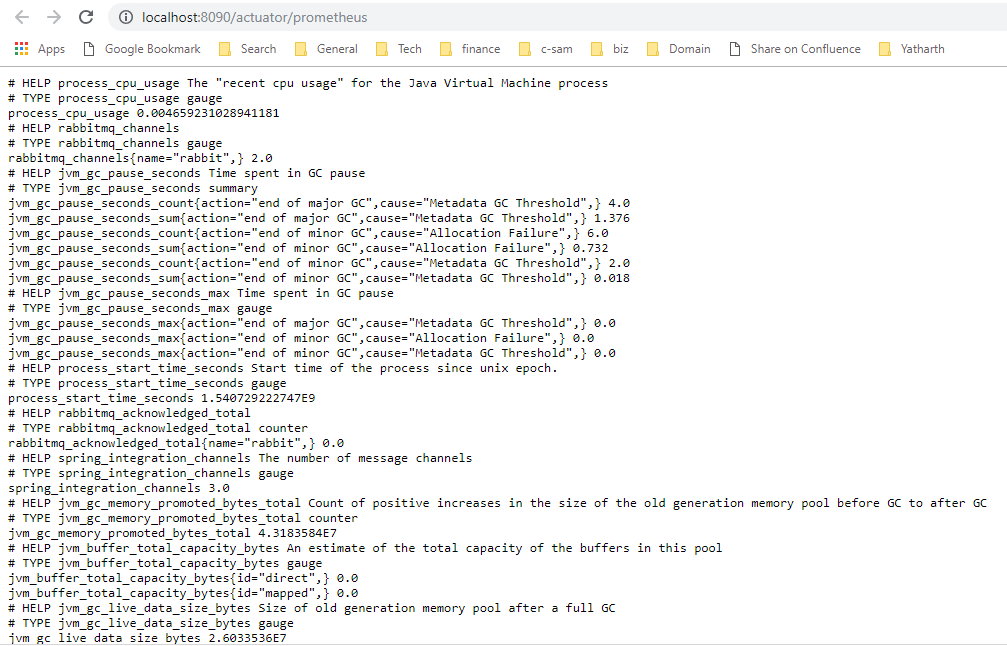
When we access /actuator/prometheus endpoint we can see lot of information pertaining to -
- JVM Memory
- Garbage Collection
- Disk Space
- Rabbitmq
- Spring Integration channels
so on and so forth. Looking at the screen shot below one can realize that it is certainly not that user friendly in terms of inferring from data that is being emitted
So we will be using Prometheus and Grafana to easily infer from the data emitted as a part of Spring Boot Actuator. Prometheus is an open source monitoring tool developed by SoundCloud. Grafana is an open platform for beautiful monitoring and analytics of time series data.
Setting up Prometheus
Download Prometheus for your corresponding environment. Update _prometheus.yml _within its root as per below configurations
 1global:
 2  scrape\_interval:     15s # By default, scrape targets every 15 seconds.
 3scrape\_configs:
 4  - job\_name: 'prometheusJN'
 5    scrape\_interval: 5s
 6    static\_configs:
 7      - targets: \['localhost:9090'\]
 8  - job\_name: 'springJN1'
 9    scrape\_interval: 5s
10    metrics\_path: '/actuator/prometheus'
11    static\_configs:
12      - targets: \['localhost:8090'\]
13  - job\_name: 'springJN2'
14    scrape\_interval: 5s
15    metrics\_path: '/actuator/prometheus'
16    static\_configs:
17 - targets: \['localhost:8091'\]Note - 8090 and 8091 are the 2 ports on which my applications i.e. Reservation Endpoint and Reservation Service are running respectively
Run Prometheus by executing following command
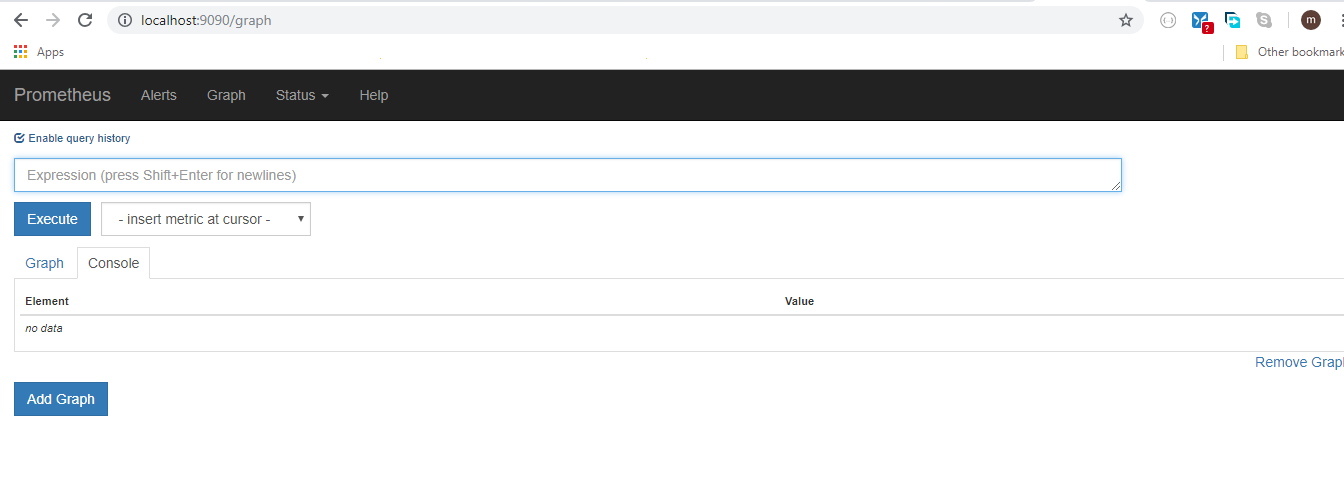
Once Prometheus is successfully up and running you can see below console which means that it is not only running on 9090 but also scrapping metrics for you as per above configurations
Setting up Grafana
Download Grafana for your corresponding environment. Setting up Grafana will be a 3 step process :
1. Datasource Configuration
Update grafana-datasource.yml (at <GRAFANA_HOME>/conf/provisioning/datasources) file with below configurations -
1apiVersion: 1
2
3datasources:
4- name: prometheusDS
5  type: prometheus
6  access: direct
7 url: http://localhost:90902. Dashboard Configuration
Update grafana-dashboard.yml (at <GRAFANA_HOME>/conf/provisioning/dashboards) file with below configurations
1apiVersion: 1
2
3providers:
4- name: 'default'
5  folder: ''
6  type: file
7  options:
8 path: H:\\\\softwares\\\\Tech\\\\grafana-5.1.3\\\\public\\\\dashboards3. Adding Dashboard
Copy mygrafana-dashboard.json file within <GRAFANA_HOME>/public/dashboards
Start Grafana server by executing following command
> .\\grafana-server.exe
Note - All the above configuration files of Prometheus and Grafana are available here
Login to Grafana console with username and password. Configure Prometheus data source so that it can get data from Prometheus to render it to the UI. Along with data source, we will add some pre-configured dashboards to visualize health of our applications viz.
- Java Micrometer Dashboard
- Spring Boot Statistics Dasboard
- Spring Throughput Dashboard
So with this entire setup we are equipped with necessary infrastructure to perform enterprise monitoring of our application.
We will now simulate load comprising of all 3 API calls -
- Save Reservation
- Fetch all Reservations
- Fetch specific Reservation
Note - We can even simulate load using Apache Bench which provides finer control in terms of performance testing and benchmarking
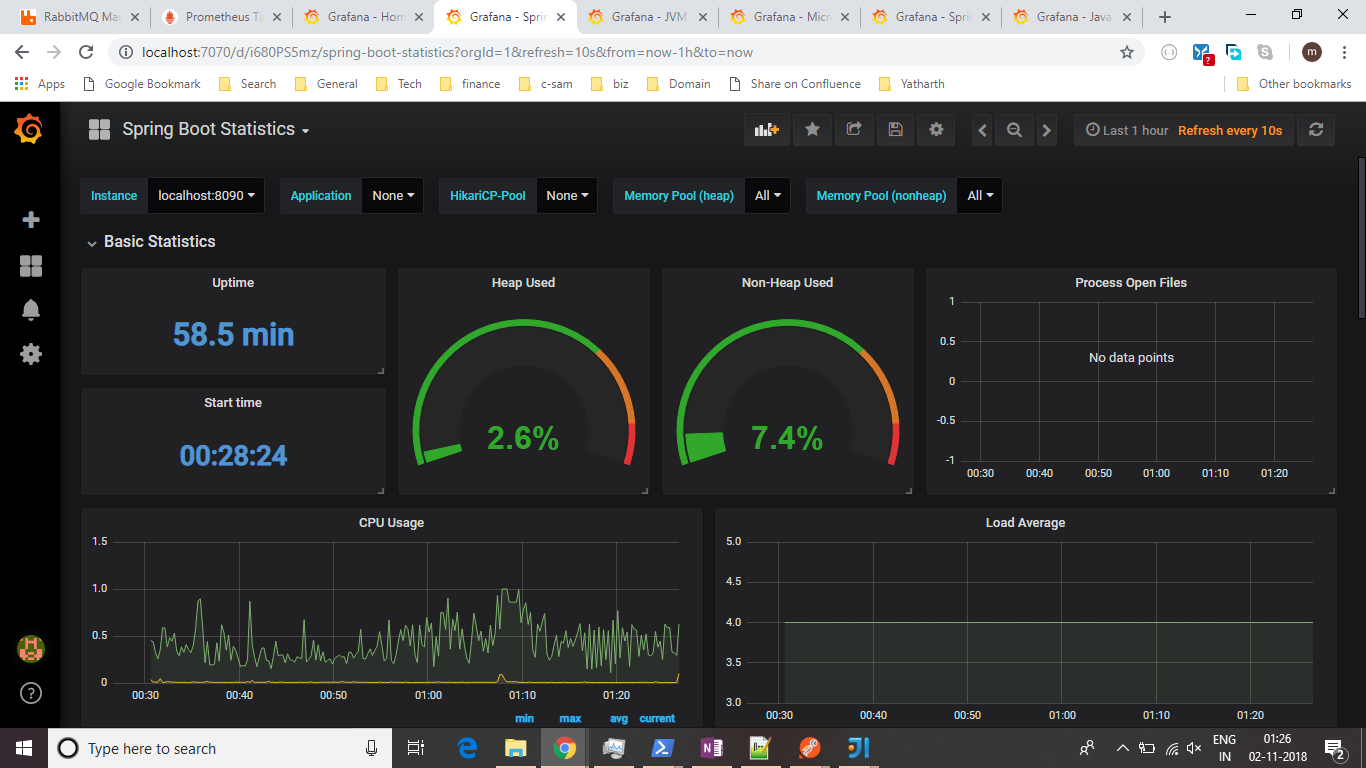
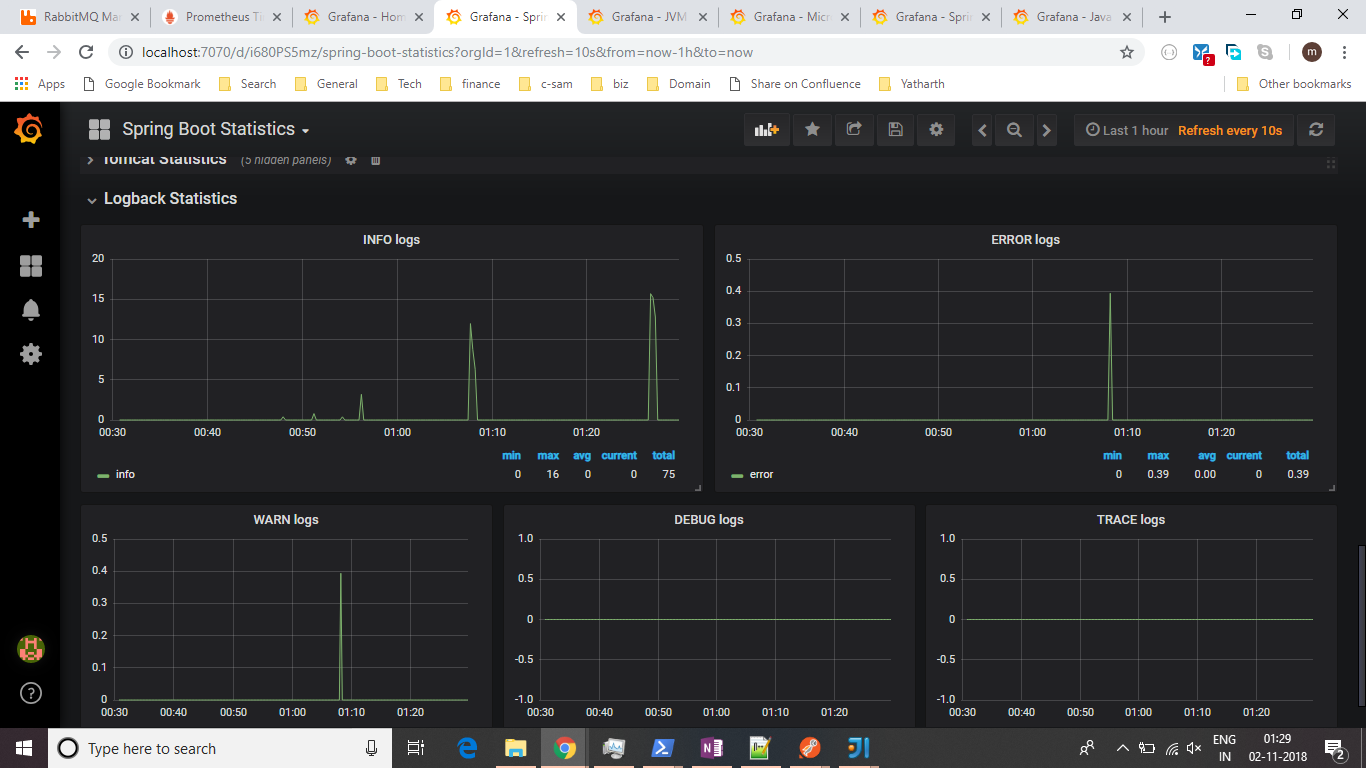
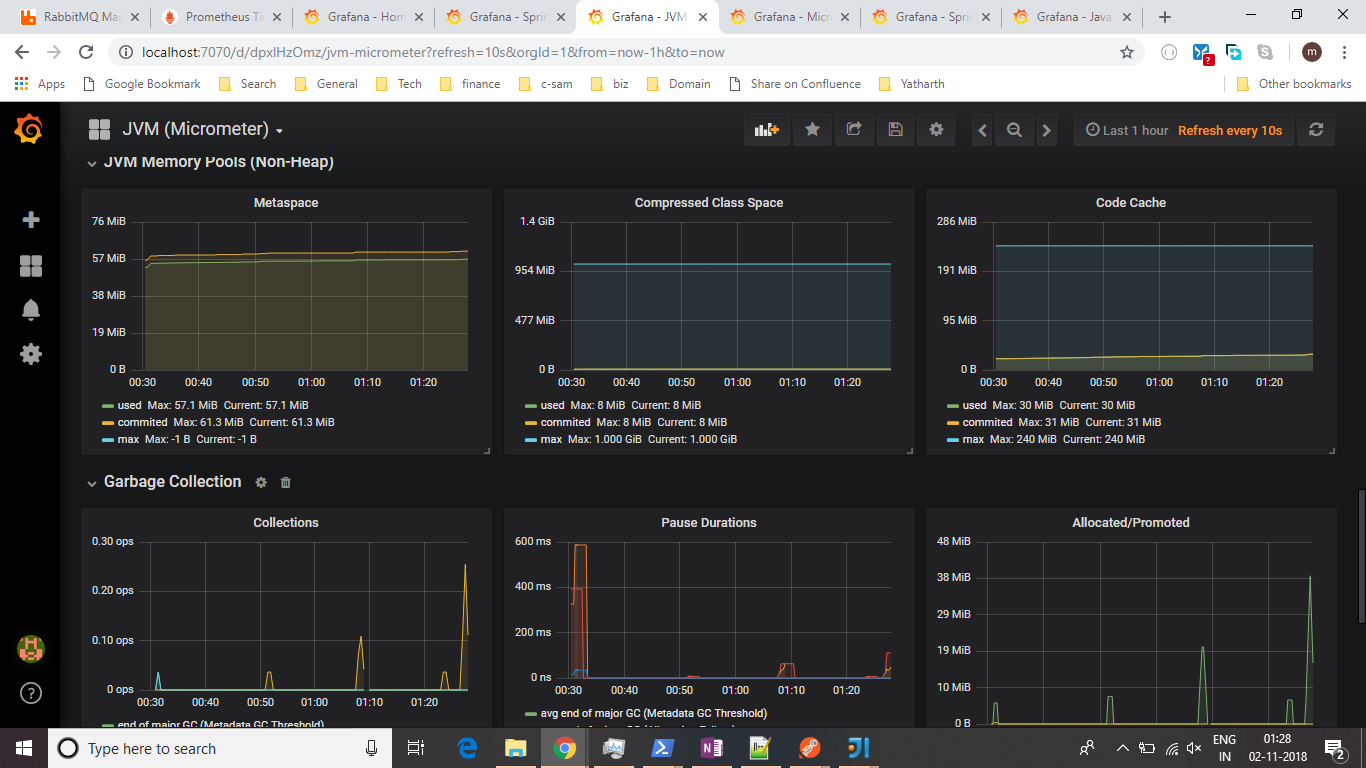
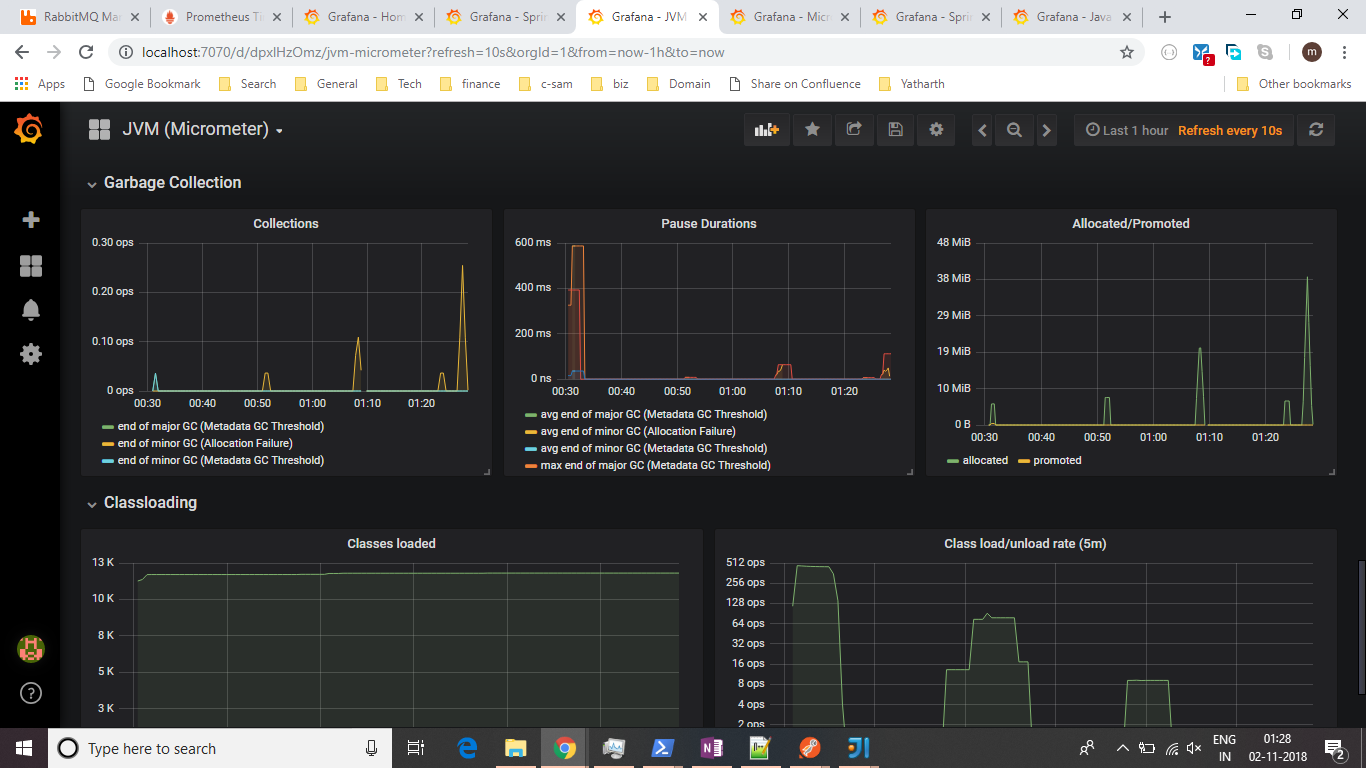
Below are some of the screen shots taken from Grafana dashboards, which are giving some insights about the state of application when it was under load
Basic Statistics and CPU usage
Logback Statistics
JVM Statistics
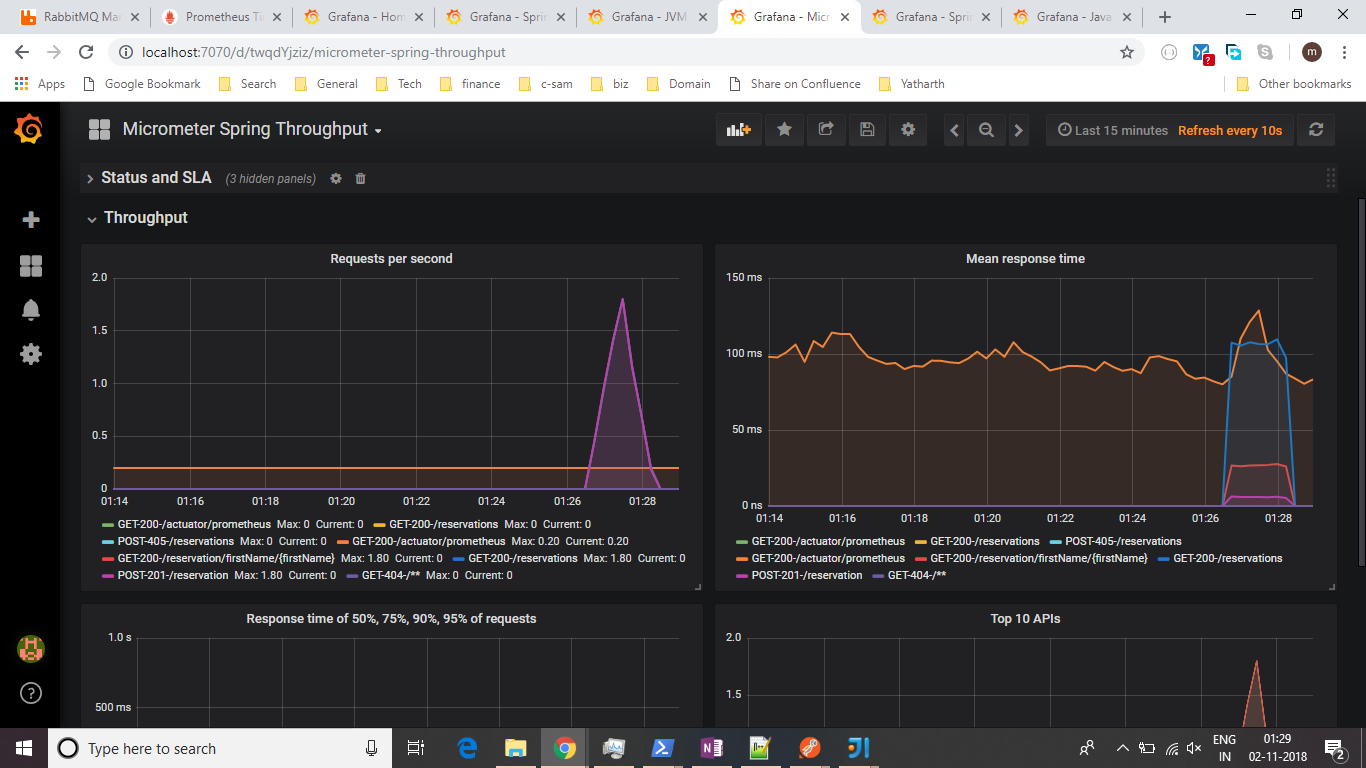
Application Throughput
Conclusion
So we saw how Spring Boot provides exhaustive time series metrics about different facets of health of an application which can help team to infer lot of insights from the available data by using monitoring and rendering tools like Prometheus / Grafana. Having said that, usage of Grafana is not just about setting up and configuring dashboards - one can create his own dashboard based on type of insights one would really like to have. One should also consider infrastructure (MongoDB and Rabbitmq here) as key aspect of the application and hence they should also be monitored closely via monitoring tools - this might be a candidate of another blog sometime later.